

RESEARCH TRIANGLE PARK – Those who need or just want to know how their communities stand in terms of social inequities and health plus resources available to help can now find a U.S-wide “dashboard” of information.
It’s the “RTI Rarity” dashboard, which the Triangle non-profit has opened for public use.
Data includes community-level risk of inequities in life expectancy, cancer mortality, drug overdoses and more, says RTI.
“We’re striving to improve the human condition in the U.S. by drawing attention to neighborhoods that need more resources to address social determinants of health and advance health equity,” said Lisa M. Lines, a senior health services researcher at RTI. She has directed the RTI Rarity project since its inception in 2019. “The new RTI Rarity dashboard offers insight into what is driving health inequities. For example, by plotting the locations of family planning clinics relative to our LSI scores for sexual and reproductive health, users can see that clinics are often missing in higher-risk areas.”
The RTI Rarity was opened for public access on Monday.
Here’s how it works:
“The RTI Rarity team uses Artificial Intelligence (AI) and Machine Learning (ML) methods to generate a suite of neighborhood-level risk scores based on local social determinants of health. The scores draw from the RTI Rarity data library of small-area measures. The project uses random forest models and other advanced AI/ML methods to understand health outcomes at the Census tract and ZIP code levels across the U.S. The composite measures are called Local Social Inequity (LSI) scores, and both the risk quantiles and selected community attributes and resources are now viewable on the new dashboard.”
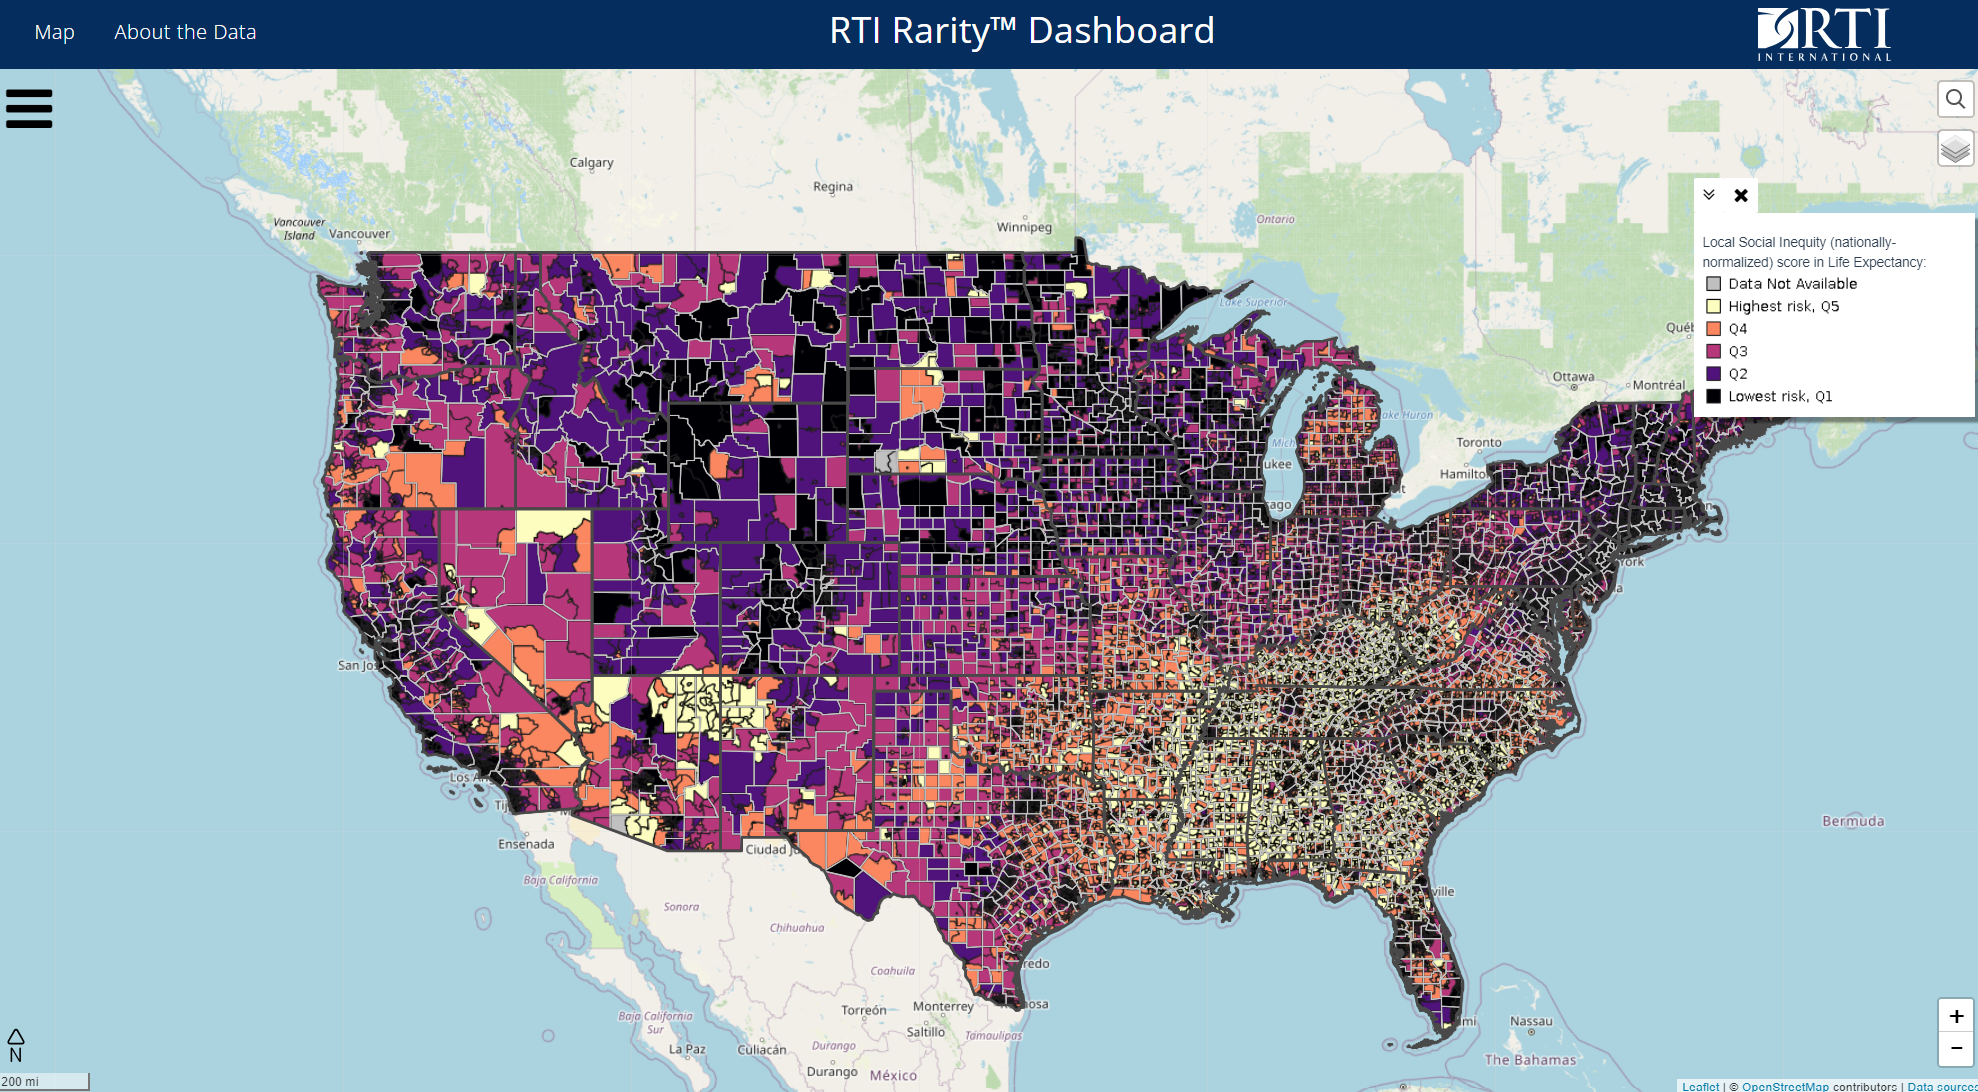
Screenshot of the RTI Rarity dashboard.
Visit the interactive RTI Rarity dashboard here.
Scoring Wake County
Here’s an example of data collected – click the above map to find, for example, Wake County’s scoring as shown in this static screenshot.

RTI RARITY INDEX WAKE COUNTY
The data captures the “Social Capital Index.” One component is:
Local social inequity in Life Expectancy (LSI-LE) is a ranked percentile score for every Census tract in the US (50 states plus DC) that represents a neighborhood’s relative risk of lower LE based on social determinants of health (SDoH). The higher the score, the lower the predicted life expectancy, based on SDoH. The scores draw on RTI Rarity’s large data library and are generated using “artificially intelligent” data science methods.
- We validated the scores against commonly used area-based composite measures related to SDoH: the Area Deprivation Index (ADI), the Social Deprivation Index (SDI), and the Social Vulnerability Index (SVI).
- In terms of life expectancy at birth, the SVI explains 26% of the variance, the SDI explains 29%, the ADI explains 43%, and LSI explains 67%. In other words, local social inequities account for two-thirds of the disparity between the neighborhoods with the highest and lowest life expectancies in the US.
- In our pilot phase, the CMS State Innovation Models Round 2 Evaluation project used LSI scores as a covariate in models testing Ohio’s Comprehensive Primary Care demonstration. Within an all-Medicaid population, in both bivariate and fully adjusted triple-difference models, local social inequities were significantly associated with a number of health outcomes that are expensive, preventable, and potentially modifiable through policy mechanisms.
Sources, coverage
The dashboard is updated regularly and includes more than 230 measures across 10 domains of social determinants of health, such as:
- income
- employment
- inequality
- educational attainment and quality
- health care access, quality, and costs
- transportation
- criminal and legal systems
- community health, well-being, and healthy behaviors
- food security and access to healthy food
- housing affordability and quality
- environmental justice (including climate change)
Data and scoring is based on more than 50 projects at RTI. Funding has come from the Centers for Disease Control and Prevention, Centers for Medicare & Medicaid Services, National Institute on Drug Abuse, Substance Abuse and Mental Health Services Administration, and others, according to RTI.


