

Editor’s note: This analysis is from the Urban Investment Strategies Center at UNC-Chapel Hill’s Kenan Institute.
+++
CHAPEL HILL – Post-2020 Census population estimates indicate that North Carolina grew more rapidly than the nation and 41 other states during the first 15 months of the pandemic (U.S. Census Bureau, Population Division, 2021). North Carolina was the nation’s fourth most attractive migration destination behind Florida, Texas, and Arizona, receiving an average of 253 net newcomers each day between April 1, 2020, and July 1, 2021. Some of the newcomers arrived from California and New York, which lost on average 923 and 861 residents per day, respectively, during the first 15 months of the pandemic (Figure 1).
Figure 1: Origins and Destinations of Migrants, April 1, 2020 – July 1, 2021
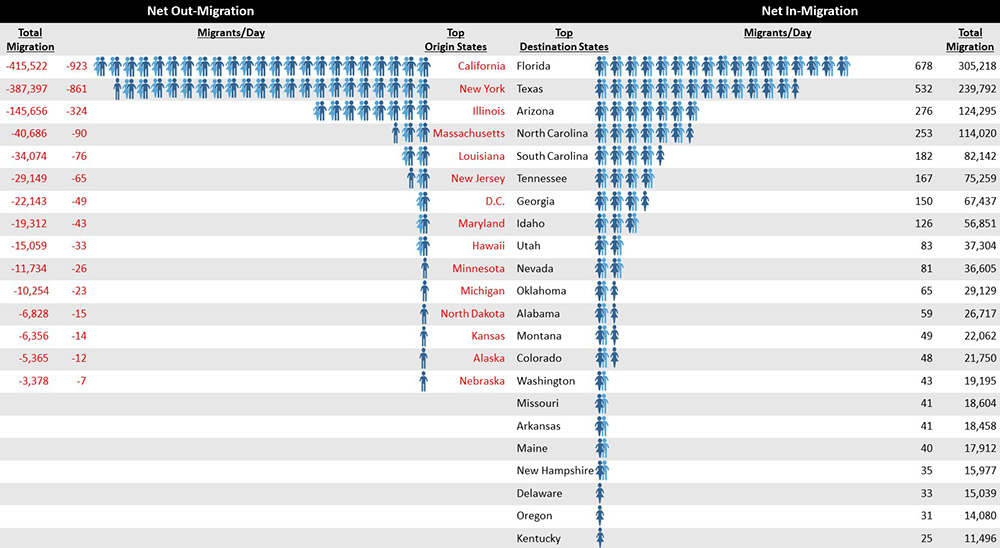
Source: U.S. Census Bureau, Population Division, 2021.
However, North Carolina’s pandemic-induced population growth was highly concentrated within the state. As Figure 2 shows, 26 mainly metropolitan and amenity rich counties captured 88 percent of the net growth (111,774), creating two major challenges (Johnson, Bonds, & Parnell, 2022).
NC County Growth Poles
April 1, 2020 – July 1, 2021 (NC=111,774)
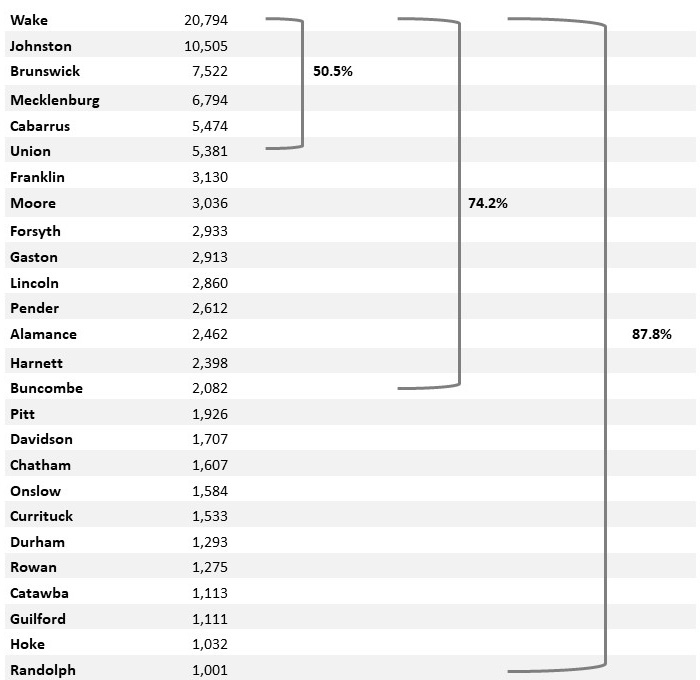
Source: U.S. Census Bureau, Population Division, 2021.
The first challenge is the remaining 74 mostly rural counties were left behind in the pandemic-induced population boom. These counties experienced slow growth, no growth, or population decline, continuing a pre-pandemic trend (Johnson, 2021b; Johnson & Parnell, 2019). The second challenge is newcomer pandemic refugees have driven up the cost of housing in our state, especially in the 26 high-growth counties where they have concentrated, but in other counties as well (Moore, 2022; Muraca, 2021; Noguera, 2022; Southern Economic Advancement Project, 2022; Campbell, 2021; Flannery, 2022; Henkel, 2022; Johnson, Bonds & Parnell; 2021; Wilson, 2020). This has created a housing affordability crisis for the state’s long-term residents, particularly first responders, police and fire, health care workers, and public school teachers—individuals responsible for protecting public health and safety as well as educating children (Gray, 2022).
The housing crisis in combination with other pandemic-induced challenges—most notably difficulties responding to the disparate impacts of the deadly virus on the health, socio-economic well-being, and life chances of people of color (Johnson, Bonds, Parnell, & Bright, 2021; Johnson, Bonds, & Parnell, 2021) –raise serious questions about the state’s ability to create a more inclusive, equitable and just North Carolina society moving forward (Johnson, 2021a; Johnson, Bonds, & Parnell, 2022). Given the uneven pattern of growth and development not only during the pandemic but over the past decade or so, the state needs targeted strategies to address existing geo-socio-demographic disparities. We offer such an approach.
Highlighting Demographic Inequities
We divided the state’s 100 counties into four groups based on net migration flows between April 1, 2020, and July 1, 2021 (Table 1).
- Fifteen counties captured two-thirds of the net migration to the state during the pandemic and therefore were labeled as the primary migration magnets (Figure 1A). Capturing 70 percent of the state’s absolute growth during the pandemic, most of these counties were the primary destinations of newcomers to the state prior to the pandemic (Johnson, 2021b). Ninety-eight percent of growth in these counties during the pandemic was due to migration. Only 2 percent was due to natural population change, that is, more births than deaths.
- A second group of 28 counties captured 29 percent of the state’s net migration during the pandemic. Most of these counties, as Figure 1B shows, are adjacent to or on the periphery of the primary migration magnets. Therefore, we labeled these counties as secondary migration magnets—areas of spillover growth during the pandemic. Twenty-two percent of the state’s absolute growth during the pandemic was concentrated in these counties.
- Foreshadowing where growth is headed in the state, an additional 36 counties captured a small share of net migration (8 percent) as rising housing prices and limited inventories pushed growth farther and farther beyond the boundaries of the state’s longstanding growth nodes (Figure 1C). We labeled these counties tertiary migration magnets during the pandemic.
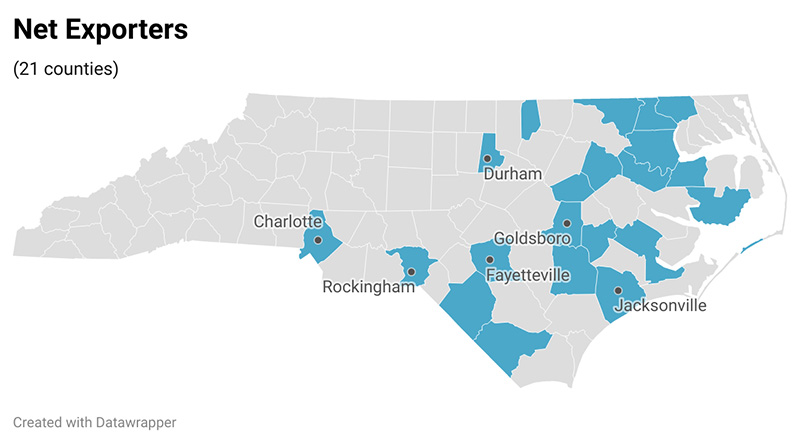
- The remaining 21 counties experienced net-out migration during the pandemic and thus were net exporters of population (Figure 1D). Three of these counties (Cumberland, Wayne, and Onslow) host military installations and therefore net out-migration is common due to troop deployments. Two of the counties were prime migration magnets prior to the pandemic, but rapidly increasing housing prices combined with limited land availability for development transformed them into net exporters of population during the pandemic (Mecklenburg and Durham). The remaining 16 counties in the group not only experienced net-out migration, but also deaths exceeded births during the pandemic. Juxtaposing these two components of population change—net migration and natural change, these counties were literally dying demographically.
Based on their respective net migration experiences, we think these four groups of counties require radically different approaches to both land development and community economic development, particularly if the state is going to demonstrate that it has strong reputational equity—a commitment to diversity, equity, inclusion, belonging, and shared prosperity—in the marketplace moving forward (Johnson & Bonds, 2021).
Table 1: Components of Population Change by County Type, April 1, 2020 – July 1, 2021.
| County Type | Number of Counties | Natural Change | Net Migration | Total Population Change |
|---|---|---|---|---|
| Primary Magnets | 15 | 1,851 | 78,752 | 80,603 |
| Secondary Magnets | 28 | -8,345 | 32,625 | 24,280 |
| Tertiary Magnets | 36 | -6,587 | 8,832 | 2,245 |
| Net Exporters | 21 | 11,004 | -5,840 | 5,361 |
| *Dying | 16 | -2,679 | -1,970 | -4,592 |
| **Other | 5 | 13,683 | -3,870 | 9,953 |
Source: U.S. Census Bureau, Population Division, 2021.
*Counties in which there were more deaths than births and out-migration exceed in-migration, producing population decline.
**Counties in which gentrification-induced rising housing costs caused net out-migration.
Recommended Approaches
In the primary migration magnets (Figure 2A), the equity train has left the station. Gentrification-induced change is in the advanced stages, housing affordability is beyond reach for the average household, small businesses are being displaced, and there is limited land for continued growth, development, and expansion (Feder, 2020; Jan, 2020; Torres & Marte, 2022; Moore, 2022; Muraca, 2021; Noguera, 2022; Lung-Aman, 2021; Sanders, 2022). Given reported involuntary or forced residential dislocations of some and the difficulties others are having in finding reasonably priced living accommodations (CoreLogic, 2022), the focus in these markets should be on the provision of workforce housing for first responders responsible for maintaining law and order and other civil servants responsible for the provision of a range of personal, household, and community services (ATTOM Staff, 2022; Moore, 2022; Muraca, 2021; Noguera, 2022; Southern Economic Advancement Project, 2022; Campbell, 2021; Flannery, 2022; Henkel, 2022; Johnson, Bonds & Parnell; 2021; Wilson, 2020; Torres & Marte, 2022). There are numerous best practices that demonstrate that workforce housing can be achieved through increased density, reclaimed brownfield sites, big box conversions, and integrated work/live developments focused on hospitals, schools, and police and fire stations (see, for example, Johnson, McDaniel, & Parnell, 2018; Bonds, Burnett & Sissman, 2018).
In the secondary migration magnets (Figure 2B), population growth has not yet accelerated to a level that widespread residential and economic dislocations of long-term residents is underway. Therefore, the window of opportunity is wide open for local leaders in these counties to institute a host of managed growth policies, practices, and procedures to (1) minimize the likelihood of a repeat of the types of gentrification-induced residential and economic dislocations observed in the primary migration magnets, and (2) ensure future development is more inclusive and equitable with both long-term residents and transplants or newcomers sharing in the growth-related prosperity. For local government officials interested in pursuing or developing such a managed growth strategy, multiple U.S. jurisdictions have developed strategies and roadmaps of inclusive and equitable development which can serve as useful models or guides (Johnson, Parnell, & McDaniel, 2018; National League of Cities, 2020, 2021; Blackwell, 2001, 2008; PolicyLink, n.d.; Truehauft, n.d.). And we have produced a checklist of policies, strategies, practices, procedures, and tactics that communities striving to achieve greater reputational equity typically pursue (Johnson & Bonds, 2021).
For most of the tertiary migration magnets and nearly all of the counties experiencing net-out migration (i.e., the net exporters of population) (Figure 2C and Figure 2D), both legacy and current policies, procedures, and practices continue to create advantage for a few and disadvantage for most residents, leading to disparate health outcomes and premature deaths manifested more often and starkly along racial lines than in the other three groups of counties (Johnson, Bonds, & Parnell, 2022; Johnson, Bonds, Parnell & Bright, 2021). These communities suffer from chronic underinvestment or investment that leads to displacement, food insecurity, employment challenges, poor access to needed services, environmental injustices, limited access to banking services, and chronic credit challenges. Nothing short of a whole community health approach that attacks the social determinants of health at the individual or group level and embraces the triple bottom line principles of sustainability at the organizational and community level is likely to ensure future viability, cohesiveness, resiliency, and prosperity in these counties (Johnson & Bonds, 2021).
Figure 2A
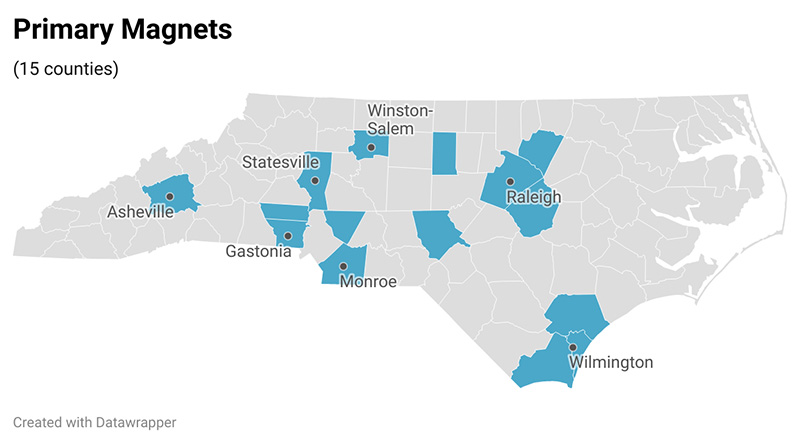
Figure 2B
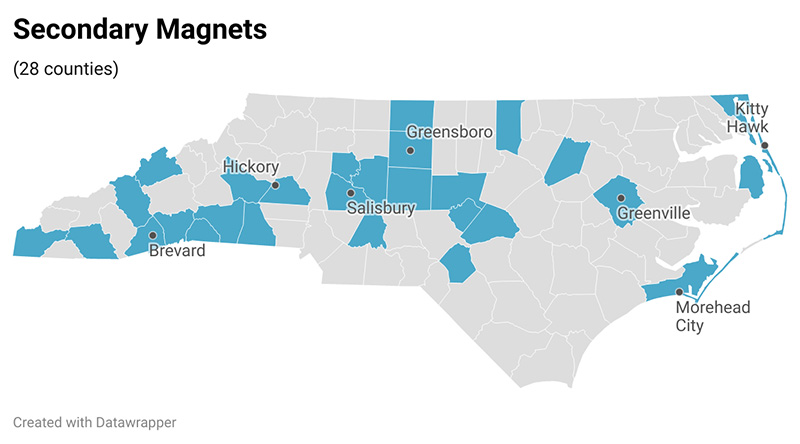
Figure 2C
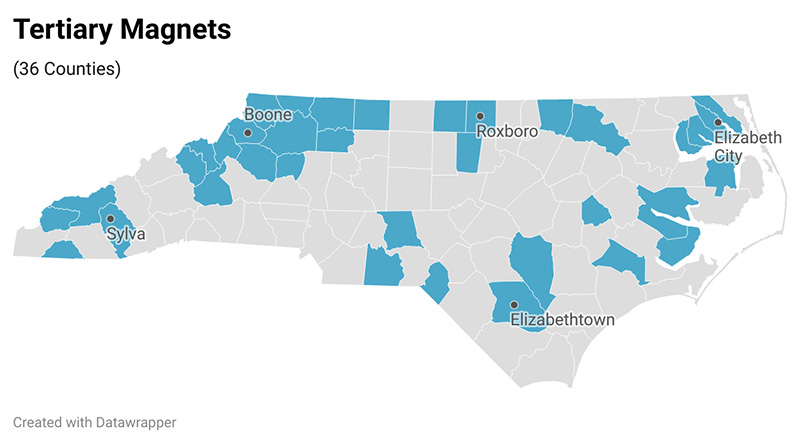
Figure 2D
Source: U.S. Census Bureau, Population Division, 2021.
The “Whole Community Health” approach matches investment to specific outcomes, focusing on jobs with living wages, work-family supports, community safety and essential services (i.e., affordable child care and health care), well-funded schools (compensated by the state for population stress’ impact on property taxes, the primary funding tool in counties), and supporting infrastructure investments that lead directly to improved health outcomes — housing, community safety, emergency response provisions, clean water, and public sewer.1
Concluding Thoughts
CNBC recently ranked North Carolina as America’s top state for business (CNBC, 2022). The rankings were based on scores on 88 metrics in 10 broad categories of competitiveness — workforce, infrastructure, cost of doing business, economy, life/health/inclusion, technology/innovation, business friendliness, education, and access to capital. Among the nation’s 50 states, North Carolina ranked 28th for life, health, and inclusion, suggesting that considerable work remains to be done to achieve whole community health and well-being in the state.
The primary economic development tools across all counties in North Carolina are incentives-driven, based on economic well-being rankings — average unemployment rate, median household income, percentage growth in population, adjusted property tax base per capita. However, there are no requirements for counties, especially newly emerging migration magnets and those in decline, to develop plans, policies, and procedures to prepare for inclusive and equitable growth that generates shared prosperity. In business recruitment and development moving forward, eliminating the geo-demographic disparities that exist in our state must be a strategic priority, and we must develop the key performance indicators and metrics to hold ourselves accountable for doing so (Johnson & Bonds, 2021). Having strong reputational equity in the global market place—demonstrated commitment to environmental justice and sustainability in the business recruitment/location process combined with inclusive workforce and entrepreneurial/small business development ecosystems that support newly recruited firms — will be instrumental in our ability to retain and sustain our current status as an attractive place to live, work, play, and do business.
1 For a concrete example, see our Whole Community Health Initiative in Edgecombe and Robeson counties—places that ranked, respectively, next to last (99th) and last (100th) in health outcomes in the Robert Wood Johnson Foundation’s 2022 North Carolina County Health Rankings.
(C) UNC-CH


